Exploring 20 million drug reports
A simple ranking beat my neural model. A 2B assistant nearly matched its teacher. The experiments behind an explorer for 20 million FDA reports.

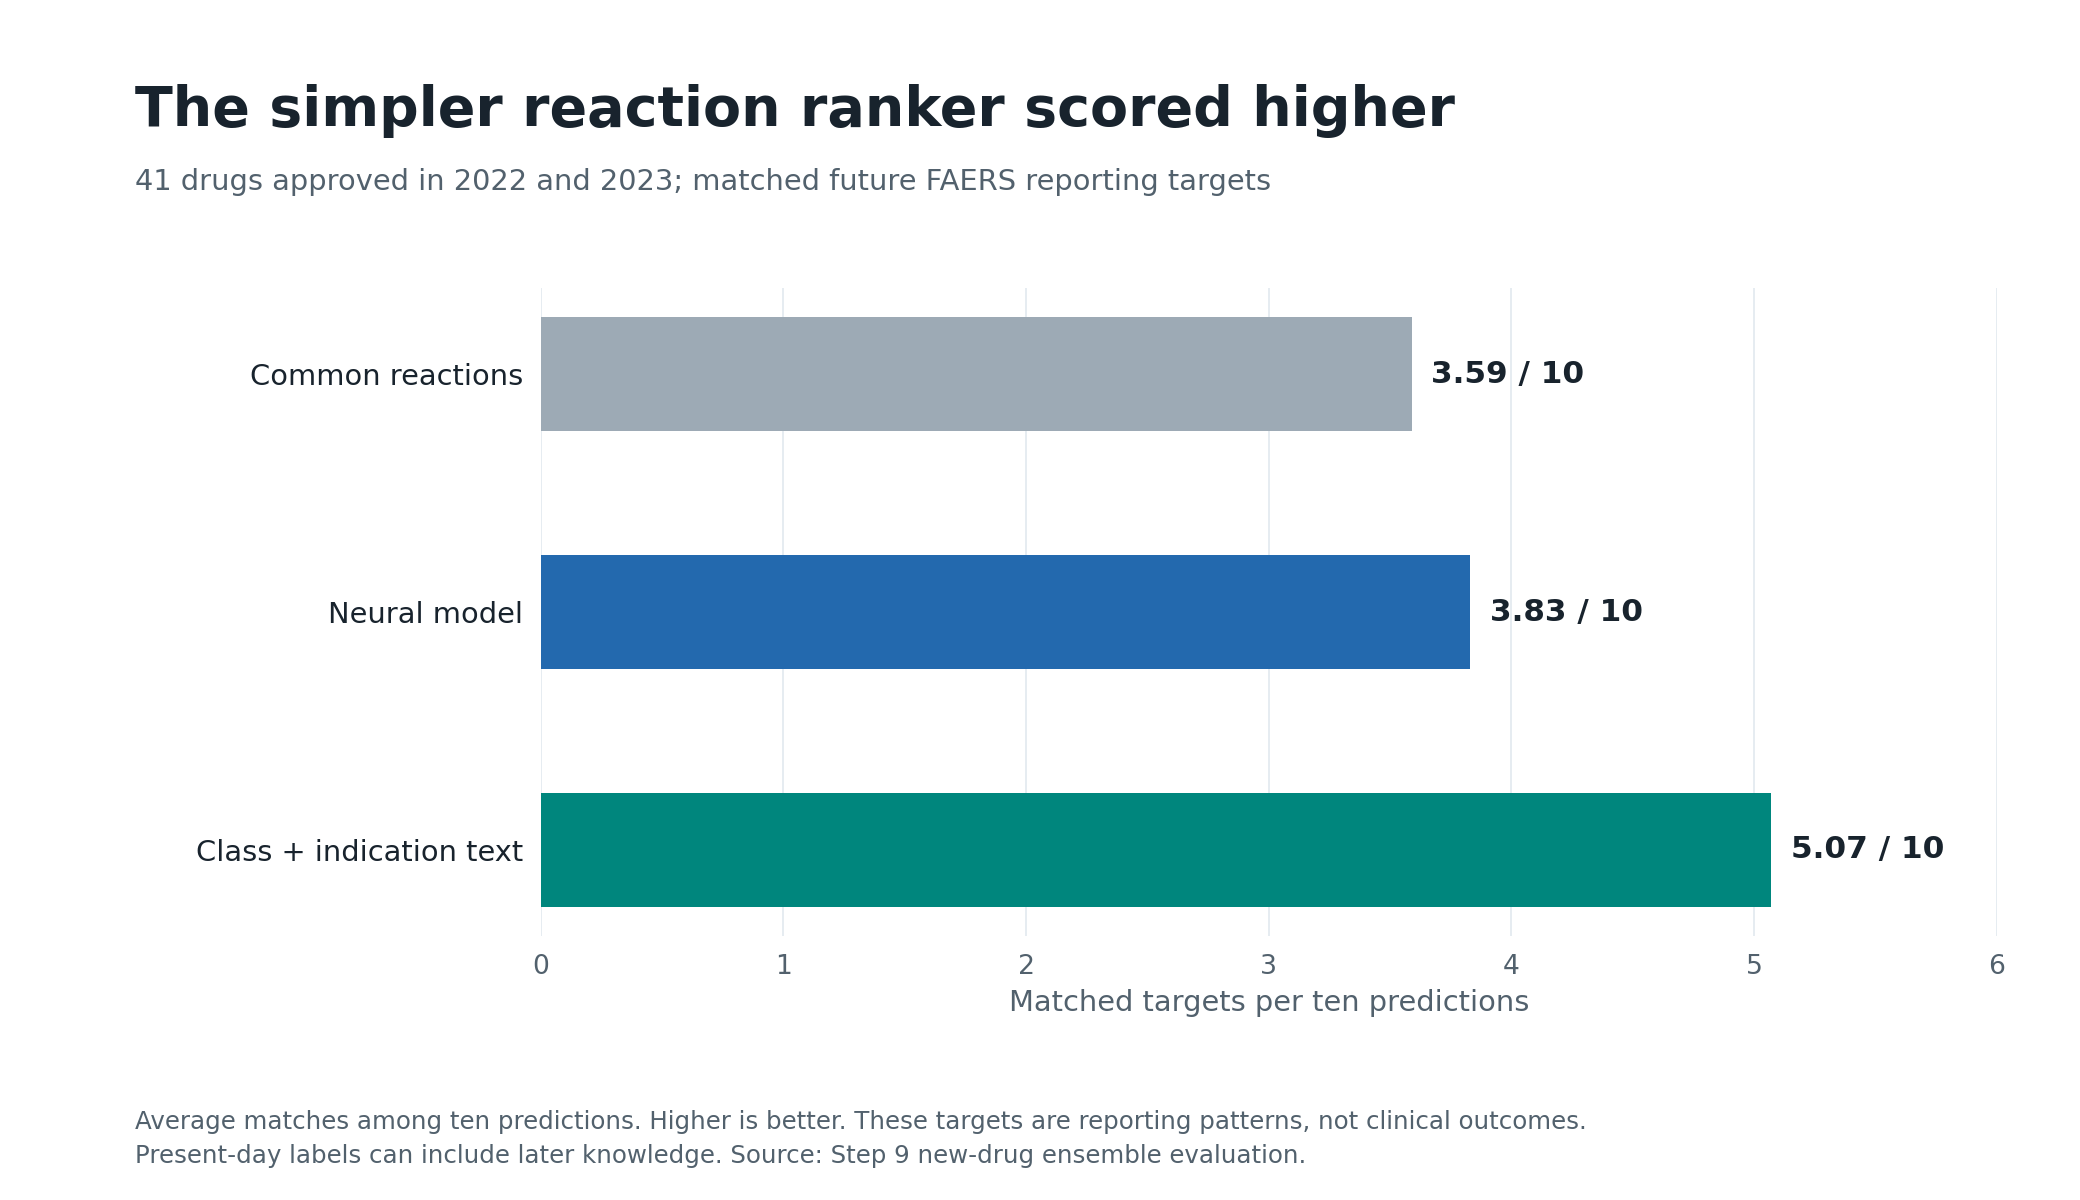
The neural model was not the best method in my drug-report ranking experiment. On 41 newer drugs, a simple combination of drug class and similar indication text matched an average of 5.07 later reporting targets in its top ten. The neural model matched 3.83. Choosing common reactions matched 3.59.
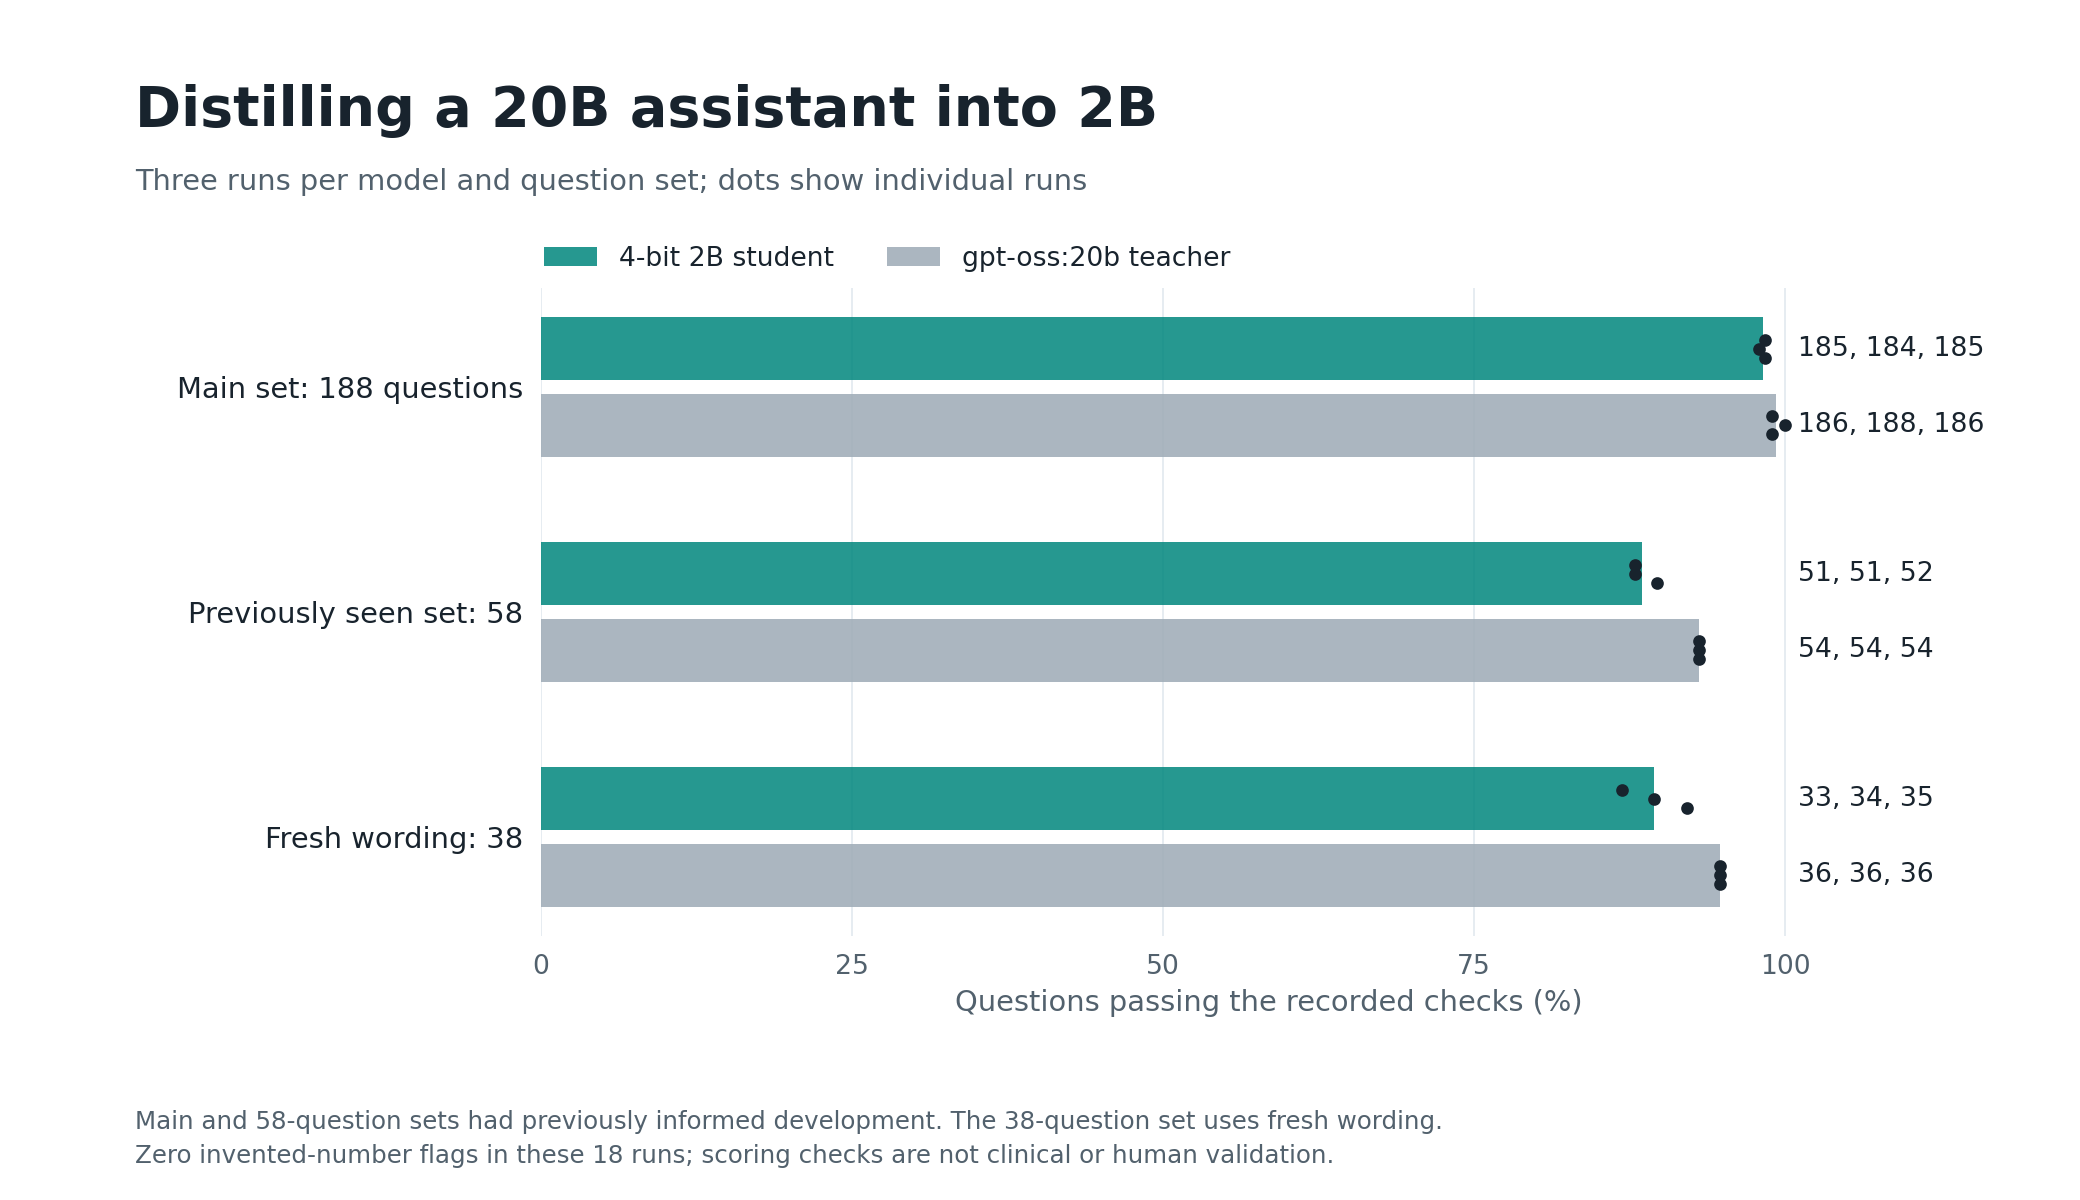
That became one of the more useful results from building MediLense, an explorer over 20,690,874 FDA adverse-event reports. Another came from its assistant: a 2B student model passed 33 to 35 of 38 questions over three runs, compared with 36 each time for its larger teacher.
Those are results about ranking reports and answering questions with tools. The database spans more than two decades, but it does not record everyone who took a medicine or establish which medicine caused an event. I wanted a way to explore it and test what the models actually added.
A simple ranking beat the neural model
The ranking experiment asked a narrow question: for a newer drug, could earlier reporting patterns help rank which reactions would appear in later FAERS reports? I compared a neural model, common reactions, drug-class matches, indication-text neighbors, and combinations. The class-and-text combination had a precision at ten of 0.507, or 5.07 matches per ten suggestions, compared with 0.383 for the neural model and 0.359 for common reactions.
I kept the simpler blend because it scored best on those 41 drugs. That result is not a clinical forecast. Its targets are later reports, not confirmed adverse effects or patient outcomes. The experiment also uses present-day drug classes and label text, which may contain information that was not available when a drug was approved. I can use it to explore a ranking method, but not to claim that it predicts what will happen to a patient.
Start with the denominator
For semaglutide, nausea appears in 14,472 of 100,836 reports naming the drug: about 144 per 1,000 reports. It is a share of submitted reports, not the chance of nausea among people taking semaglutide.
FAERS, the FDA Adverse Event Reporting System, allows a report to list several medicines and reactions. A medicine can be marked as suspect, concomitant or interacting. Keeping those details beside the count makes it easier to see what a comparison includes.
The import also removes 1,816 repeated rows from 20,692,690 inputs, a small cleanup because openFDA already collapses most follow-ups; the larger counting risk is treating every drug-reaction pair as a separate report.
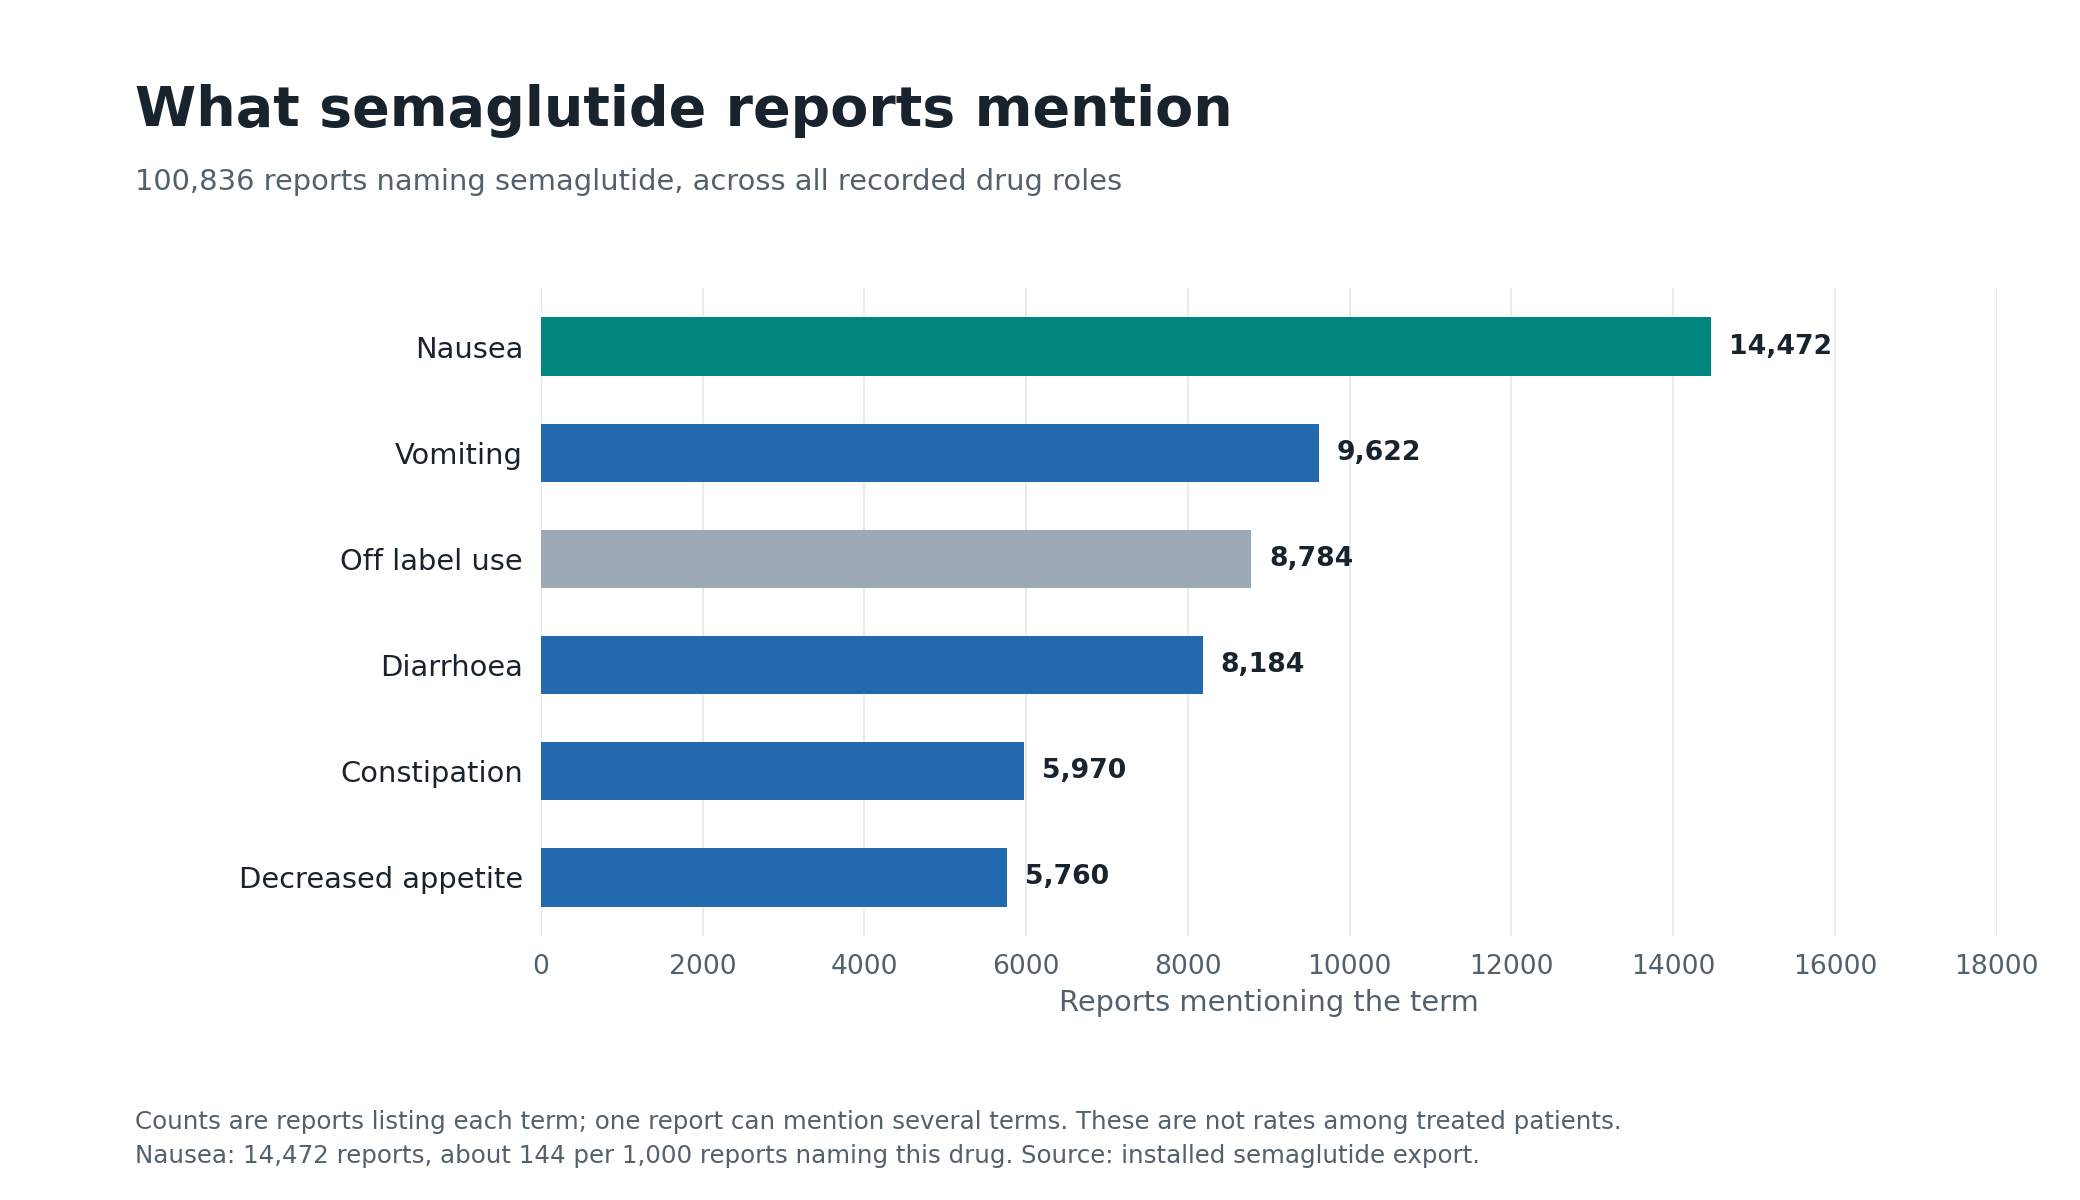
A profile gives me a starting point for investigation: compare the same reaction across drugs, follow its reporting history, or ask whether a pair stands out against background reporting. A disproportionate reporting measure can help surface a pair for investigation; it cannot establish causation or personal risk. The FDA describes these limits of FAERS.
Then, see how much model was actually needed
The assistant is one way to ask questions of the same data. I wanted to know whether it needed a 20-billion-parameter teacher model for the work, so I tried distilling its behavior into a Qwen3.5-2B student. I generated 2,577 candidate questions, had the teacher answer 1,880, and retained 1,808 checked conversation traces for training. Training included the tool calls and returned data alongside each question and answer.
One early evaluation looked disastrous: 19 passes out of 188. The exported model had not loaded. Those 19 were questions the surrounding code could answer without it. The export configuration still counted a multi-token-prediction block whose weights had been dropped; disabling that block fixed the load. Reading the failed answers prevented me from treating an export failure as a model-quality result.
I compared both models on a fresh set of 38 naturally phrased questions about drugs reserved from training. Across three runs, the student passed 33, 34, and 35 cases; the gpt-oss:20b teacher passed 36 each time. The student came close, but did not match the teacher. Thirty-eight questions is a small test. The raw scores show the remaining gap without turning this task-specific result into a claim about general model quality.
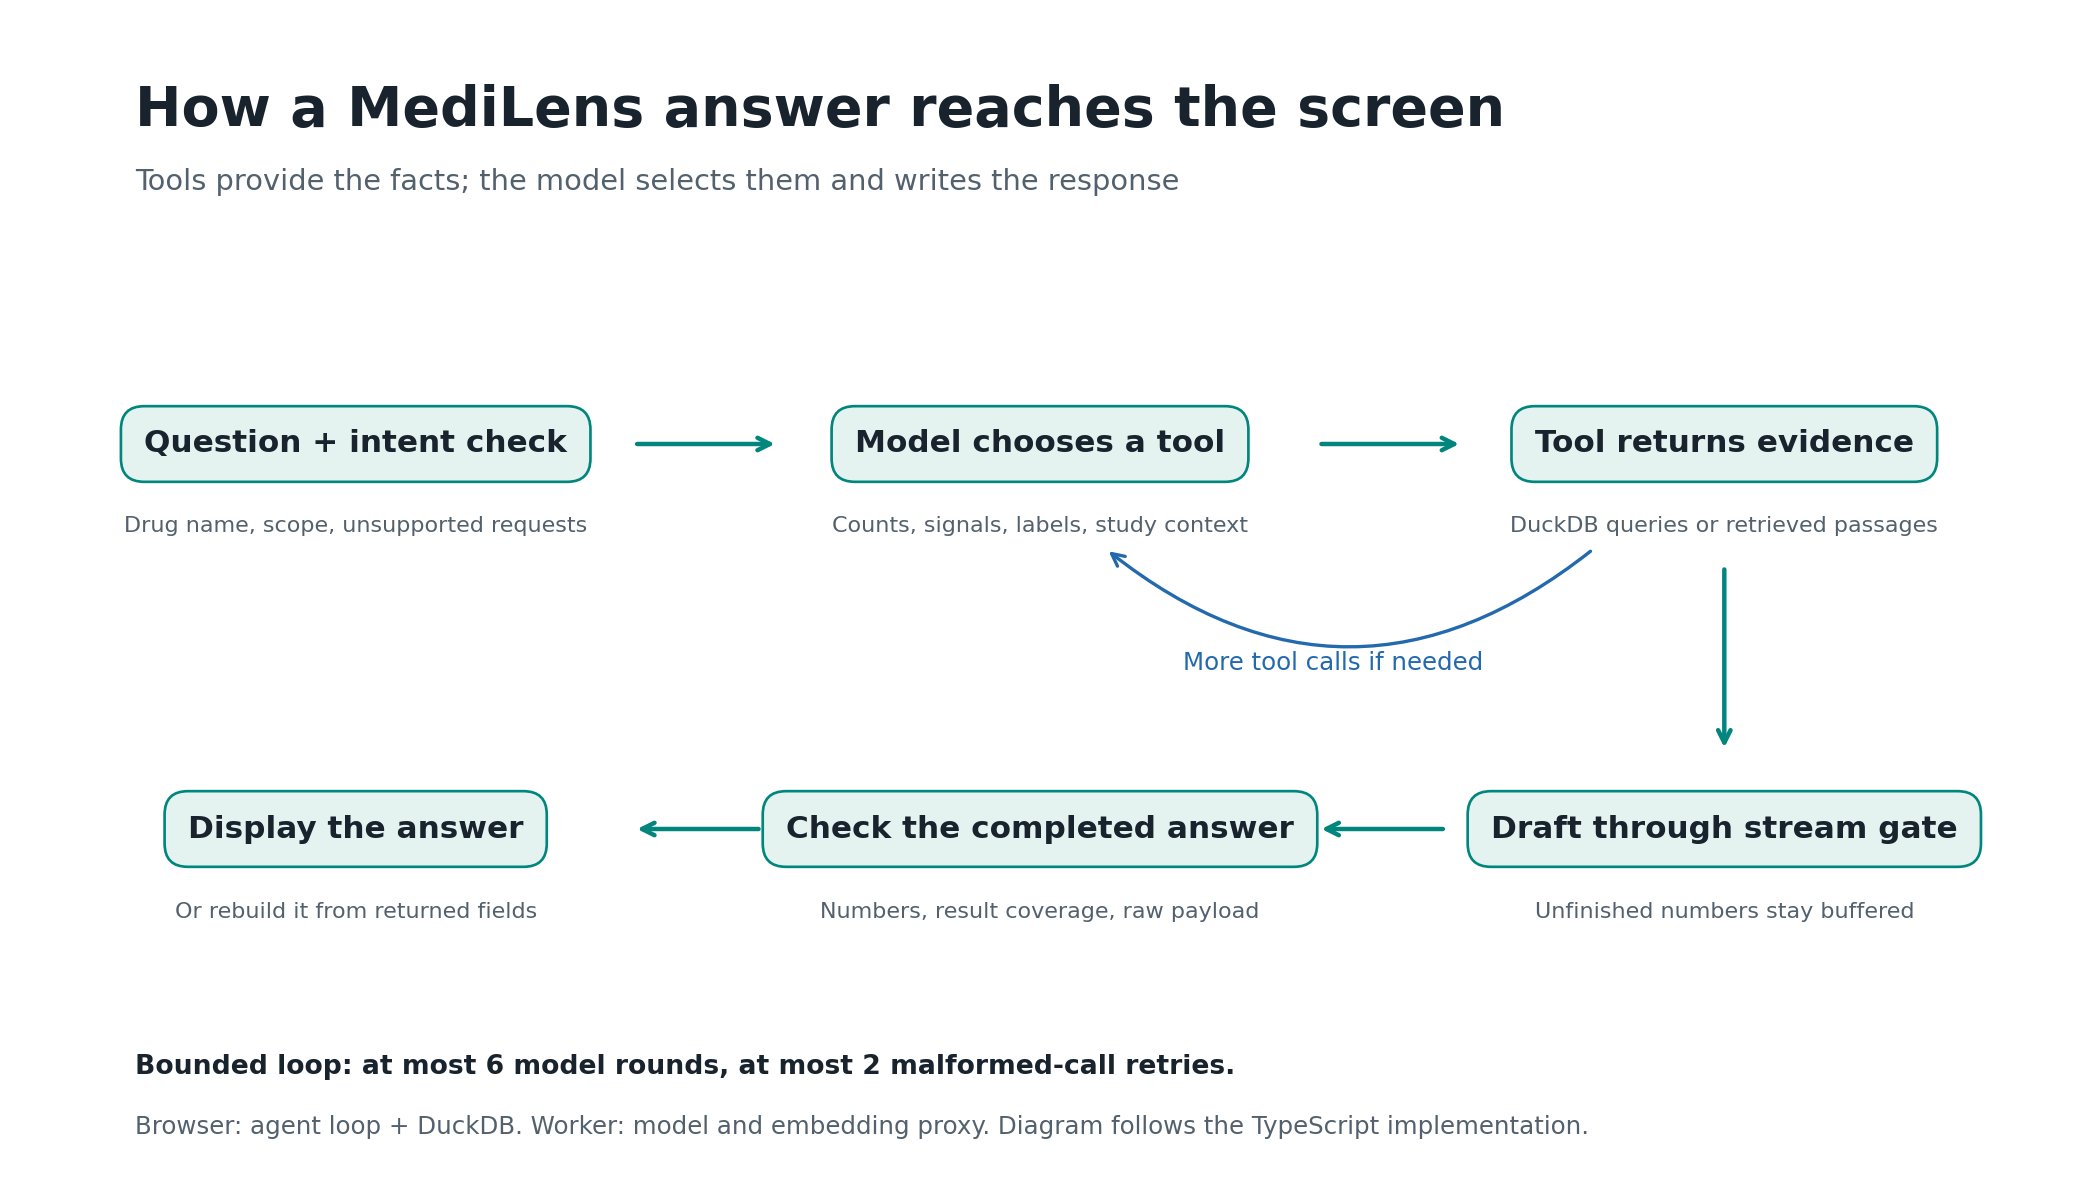
The score also depended on the tools and checks around the model. MediLense resolves a drug name, runs a count or signal query, then checks that answer numbers appear in allowed inputs and tool results and that the response covers what was requested. A failed draft can be replaced with an answer assembled from returned fields. These checks caught specific failures in evaluation, but a number can be supported by a tool result and still be explained incorrectly.
Keep the evidence close to the question
The same principle guided the browser explorer. I export the data as Parquet and query it with DuckDB-WASM; a Worker passes byte-range requests through to hosted files. In the recorded report-detail example, the browser transferred about 5 MB rather than downloading a roughly 300 MB table. The point is practical: an individual investigation can stay close to the data without loading the whole collection first.
The comparison screen puts two drugs' report profiles side by side, with reaction counts per 1,000 reports of each drug. The Signals page adds PRR, ROR and IC, which compare how often a drug and reaction occur together with their background reporting frequencies. A high count and a strong reporting signal are different questions; neither ranks treatments by safety.
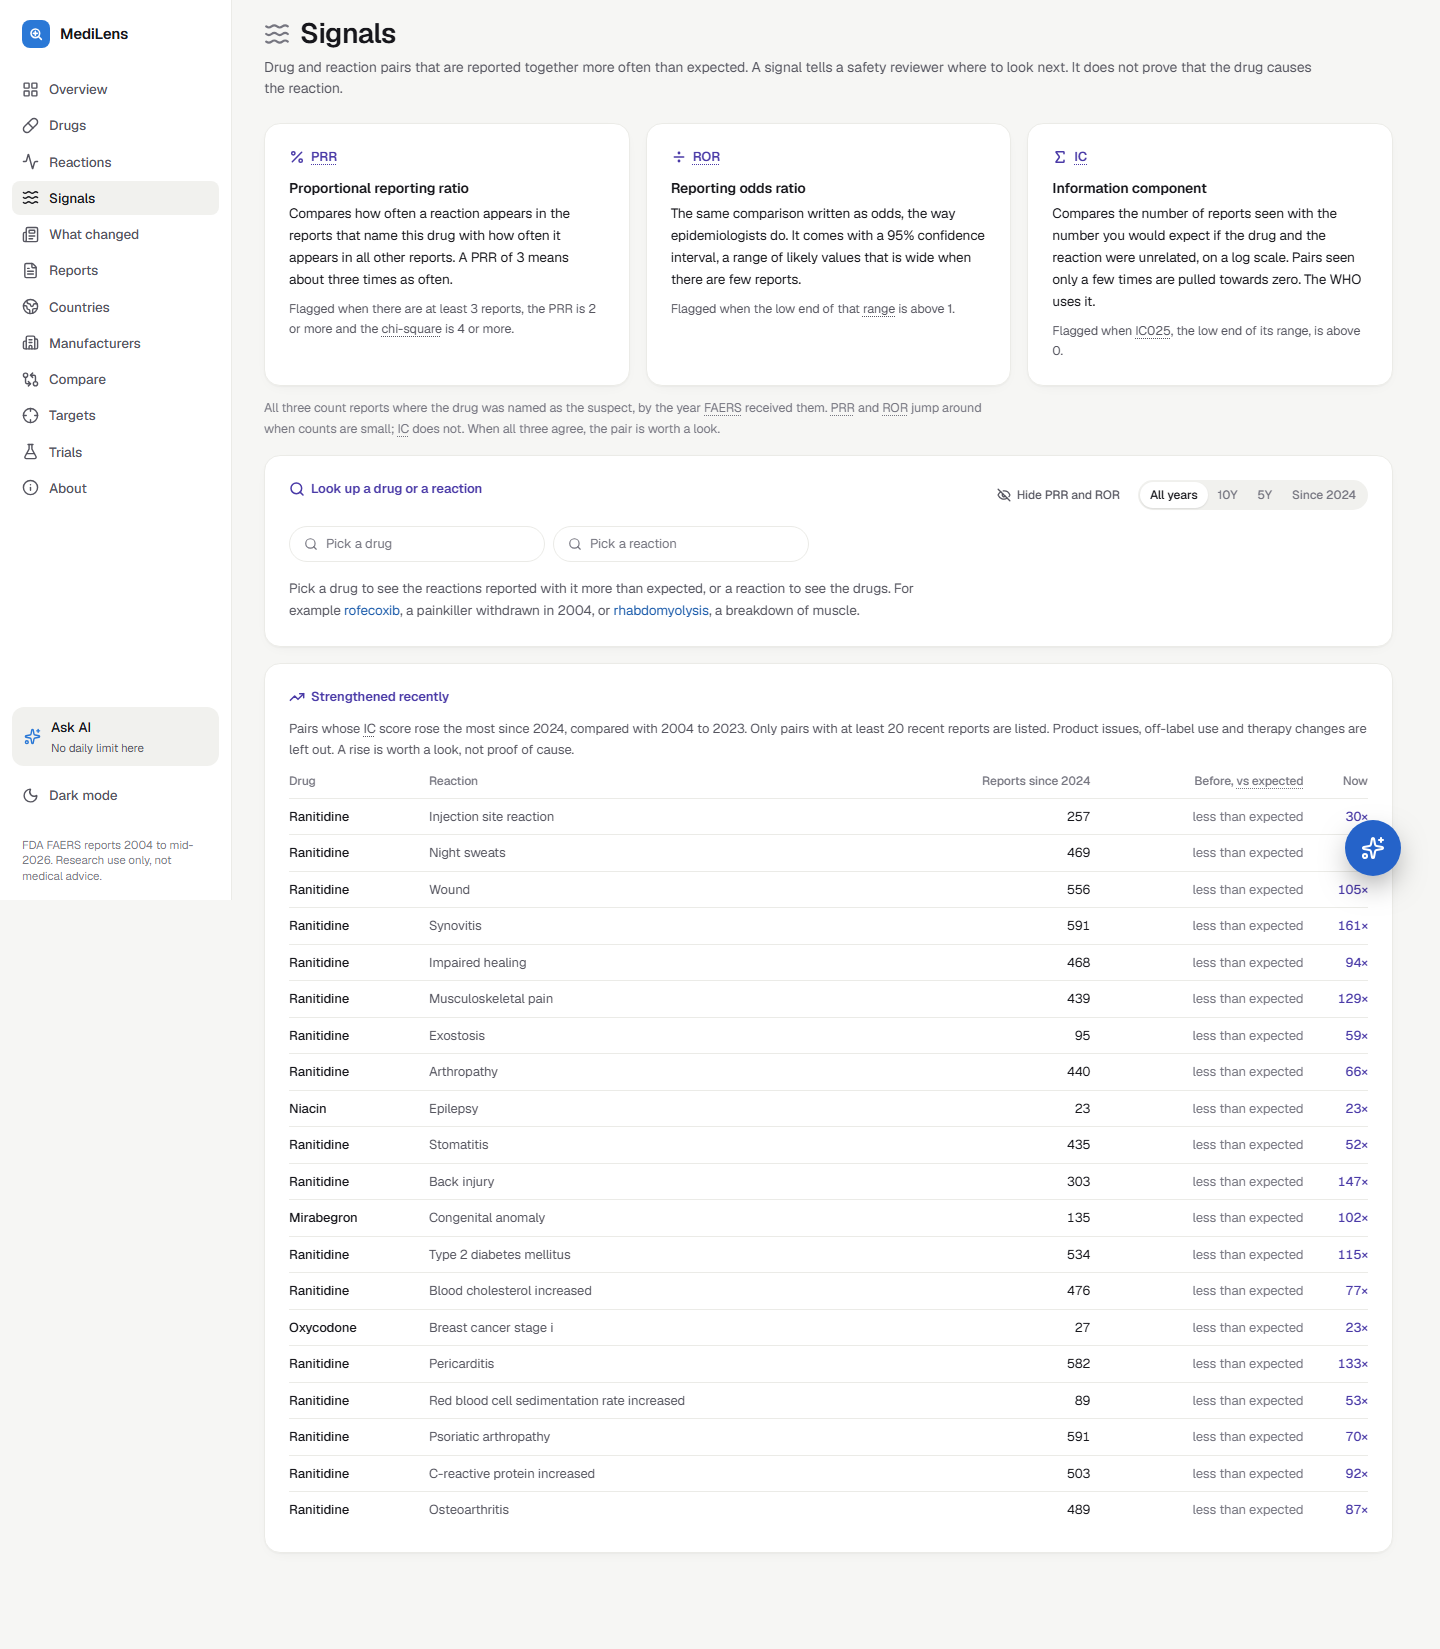
The experiments gave me two concrete decisions. For exploratory reaction ranking, the class-and-text method scored better than my neural model. For the assistant, the smaller model was close enough to keep testing, with a visible accuracy gap. I can inspect both results and trace a displayed count back to its reports. That is a more useful foundation for this explorer than assuming every task needs a larger model.
You can try the MediLense explorer; the project notes document the data pipeline and experiments.