Trying to predict Formula 1
Building an F1 prediction model with race data and 20,000 simulations, then testing its forecasts against the grid, Kalshi and Polymarket.

After qualifying, my F1 model picked 35 winners across 64 races. Choosing the pole sitter would have picked 38.
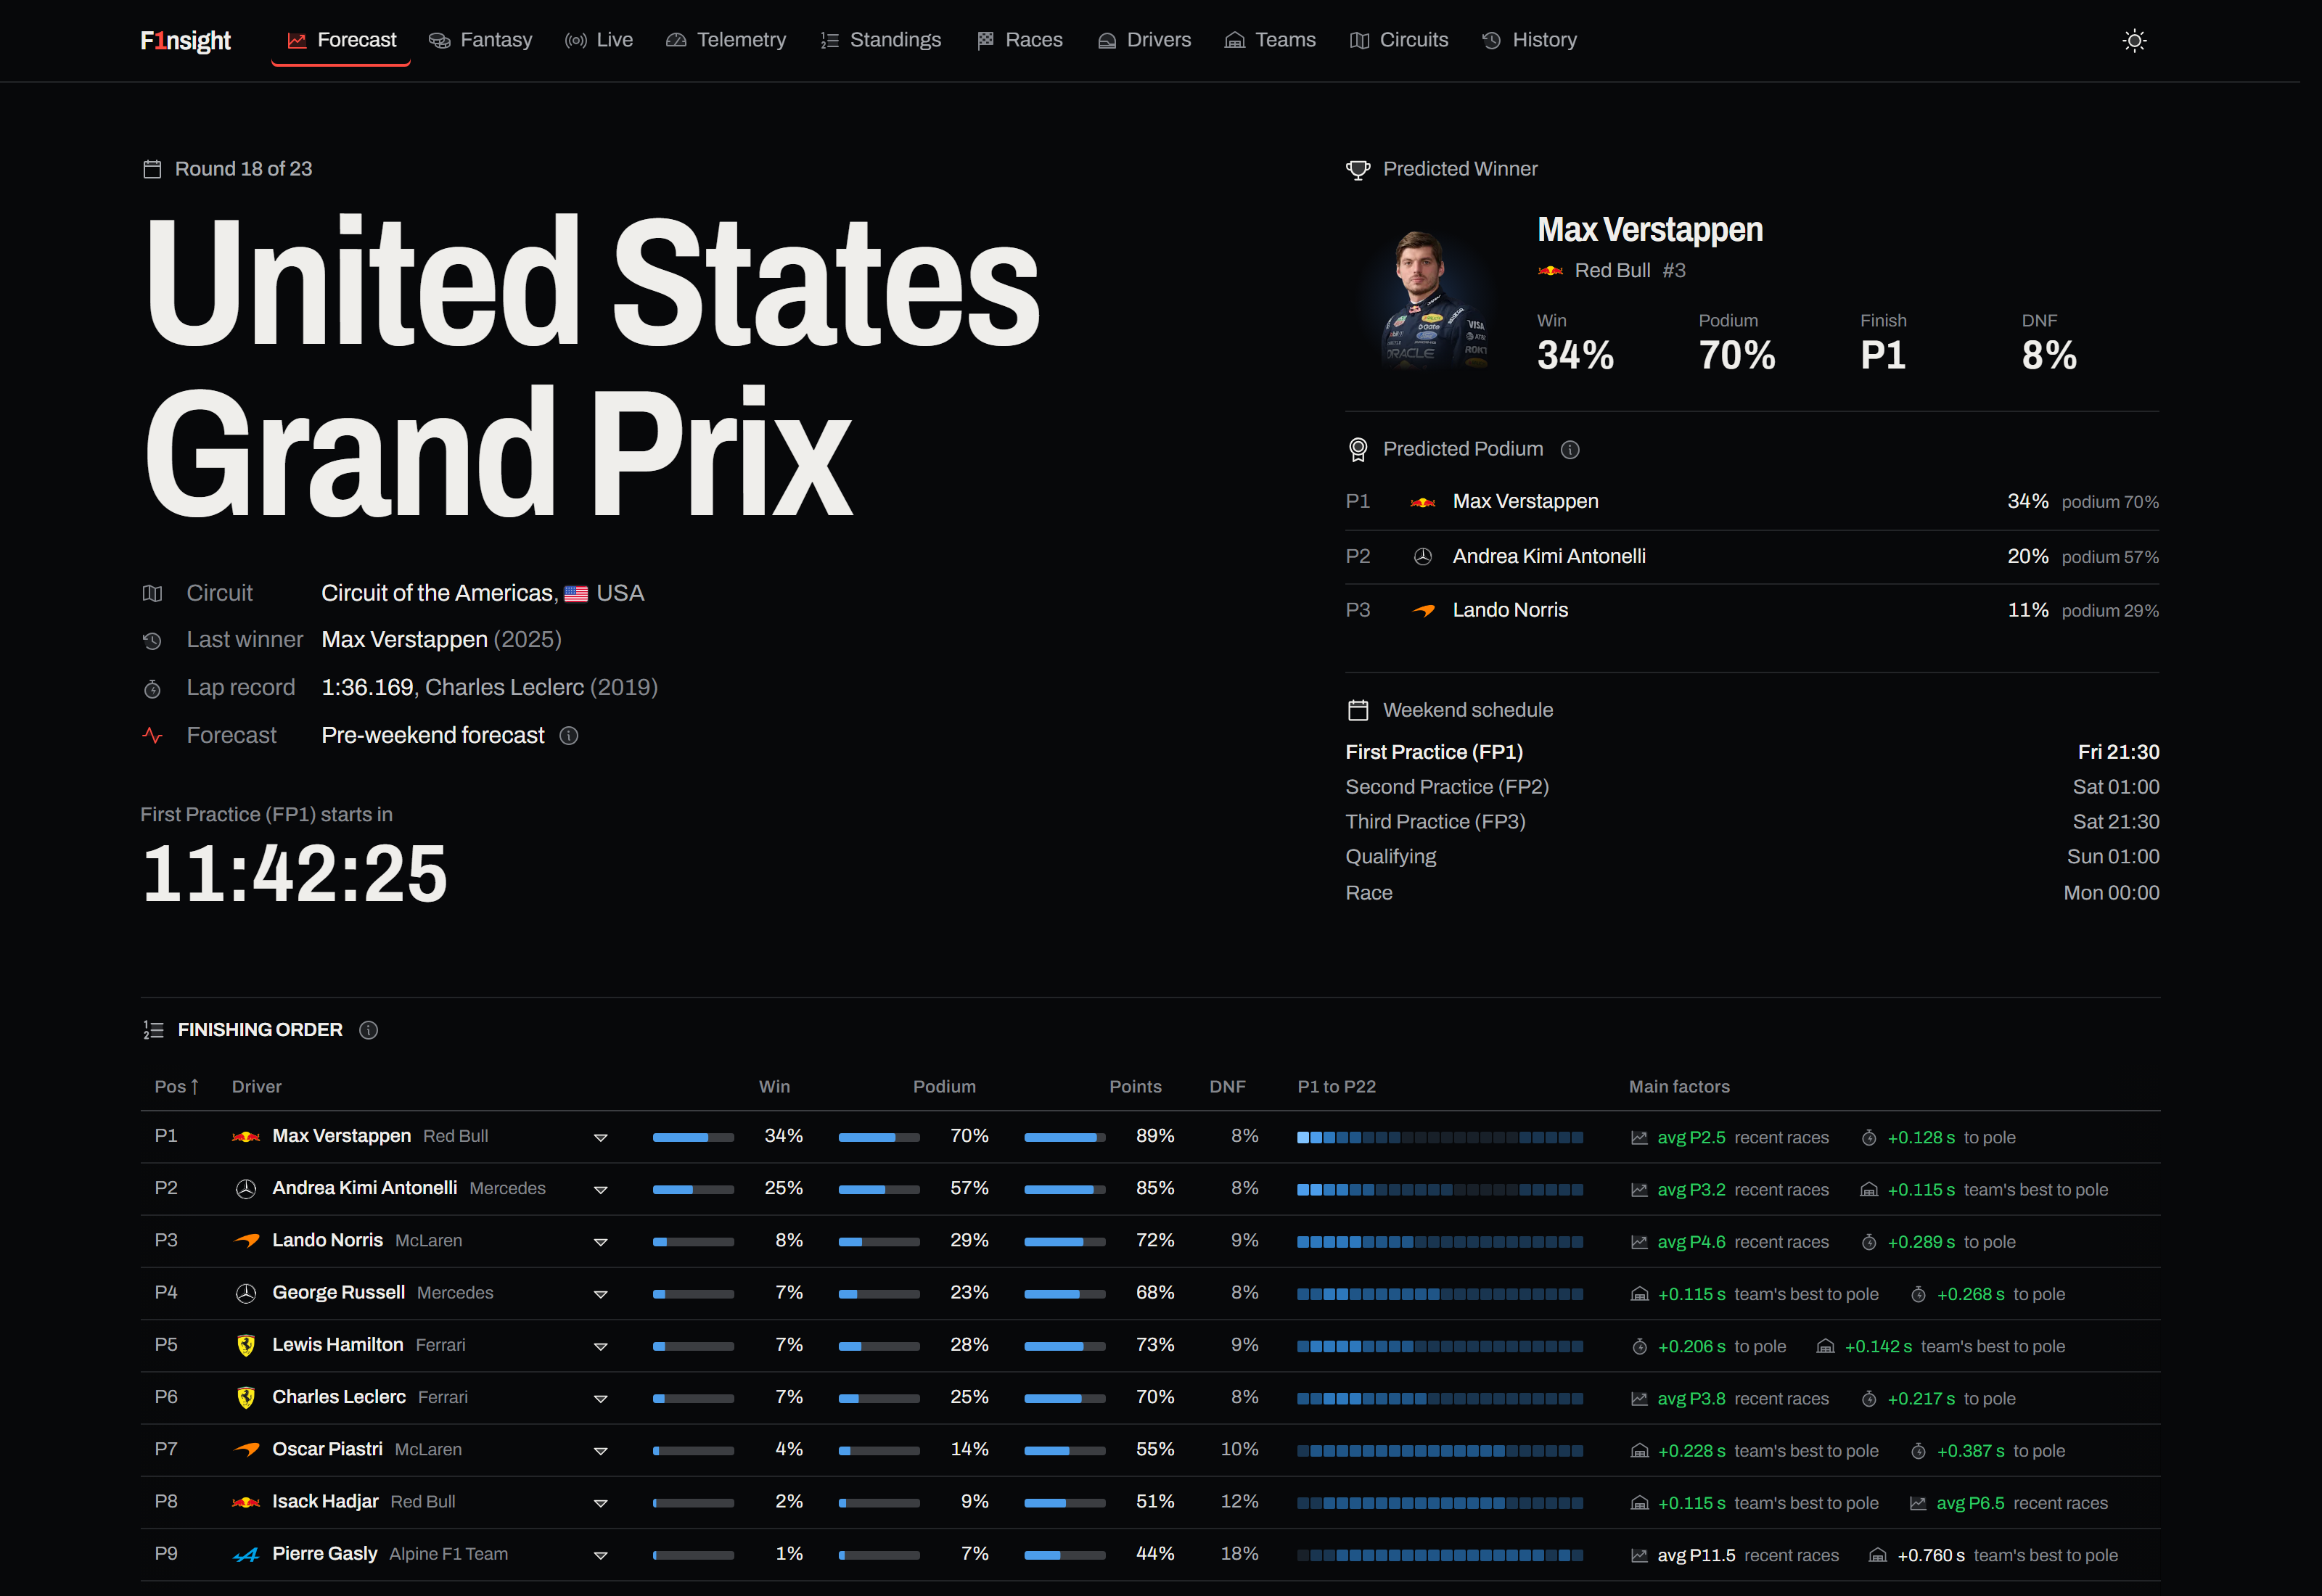
I built F1nsight to find out how much of a race can be predicted from previous results, driver and team form, and the information arriving through a weekend. The model runs 20,000 simulations per forecast. Losing the winner-pick comparison to the first name on the grid was a useful answer to that question.
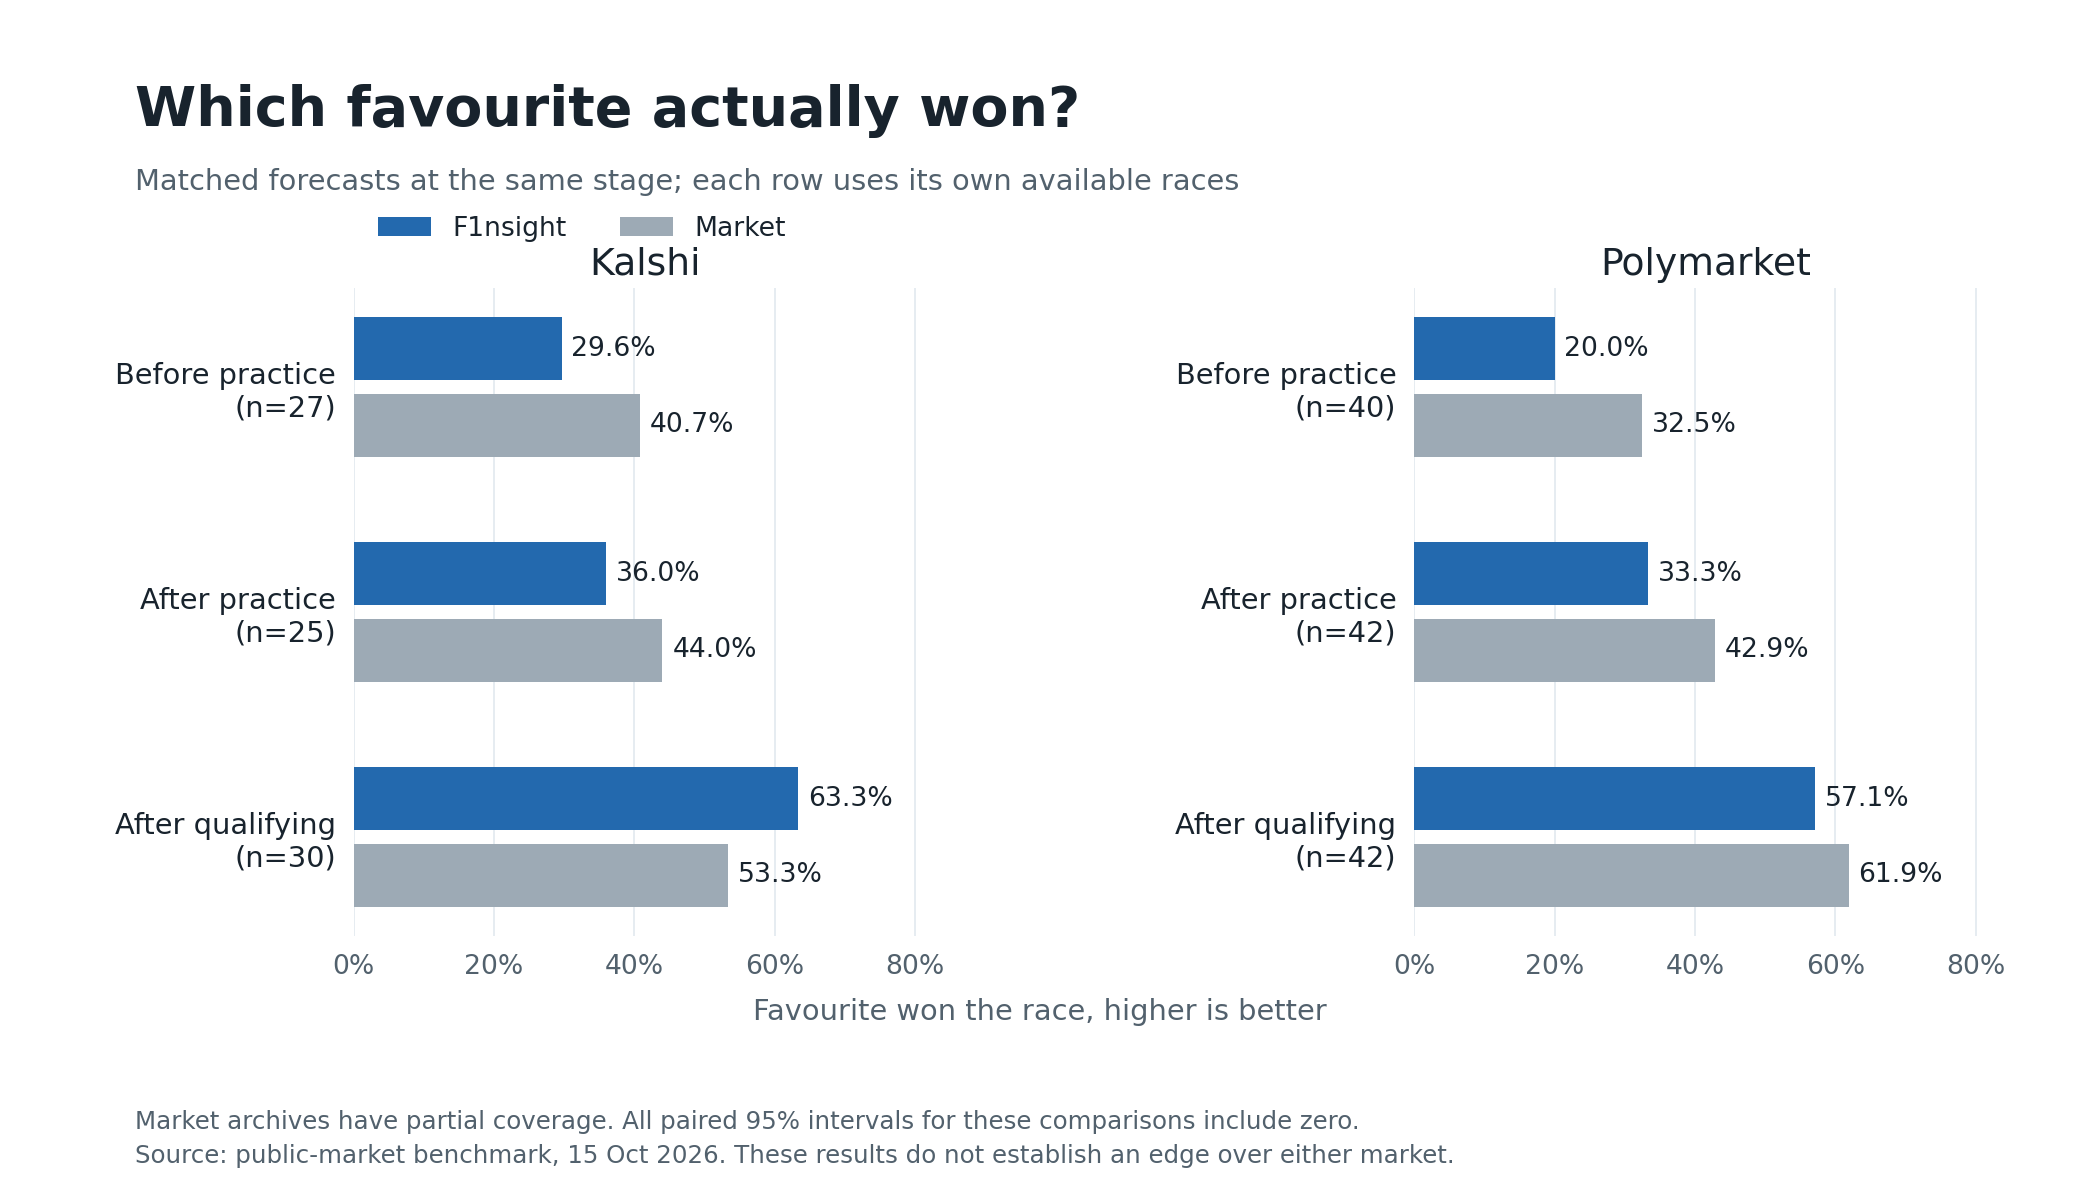
The markets made it harder too. After practice, Kalshi's favourite won 44% of its matched races against the model's 36%; Polymarket scored 43% against 33% on a different matched sample. On winner log loss, where lower is better, the model scored lower than Kalshi at all three stages and lower than Polymarket after practice. It scored higher than Polymarket before the weekend and after qualifying. That is four lower scores in six comparisons, but all six paired 95% intervals include zero.
There was progress inside those results. One change improved the forecasts before qualifying without adding any new data: sample 100 possible grids, then let the race model predict from each of them.
A better link between qualifying and the race
An earlier version predicted qualifying and the race separately. It knew starting position mattered, but before qualifying it had no actual grid to pass to its race forecast. I changed the pre-qualifying simulation to draw 100 possible qualifying orders, turn each into a grid, and run the race model from that grid. After qualifying, the model uses the actual starting grid.
On the same 64 races, this change lowered mean winner log loss from 1.918 to 1.790 before the weekend, and from 1.690 to 1.578 after practice. Lower log loss means the model assigned more probability to the eventual winners, while accounting for how confident it was. The post-qualifying score stayed at 1.202 because that forecast already used the grid.
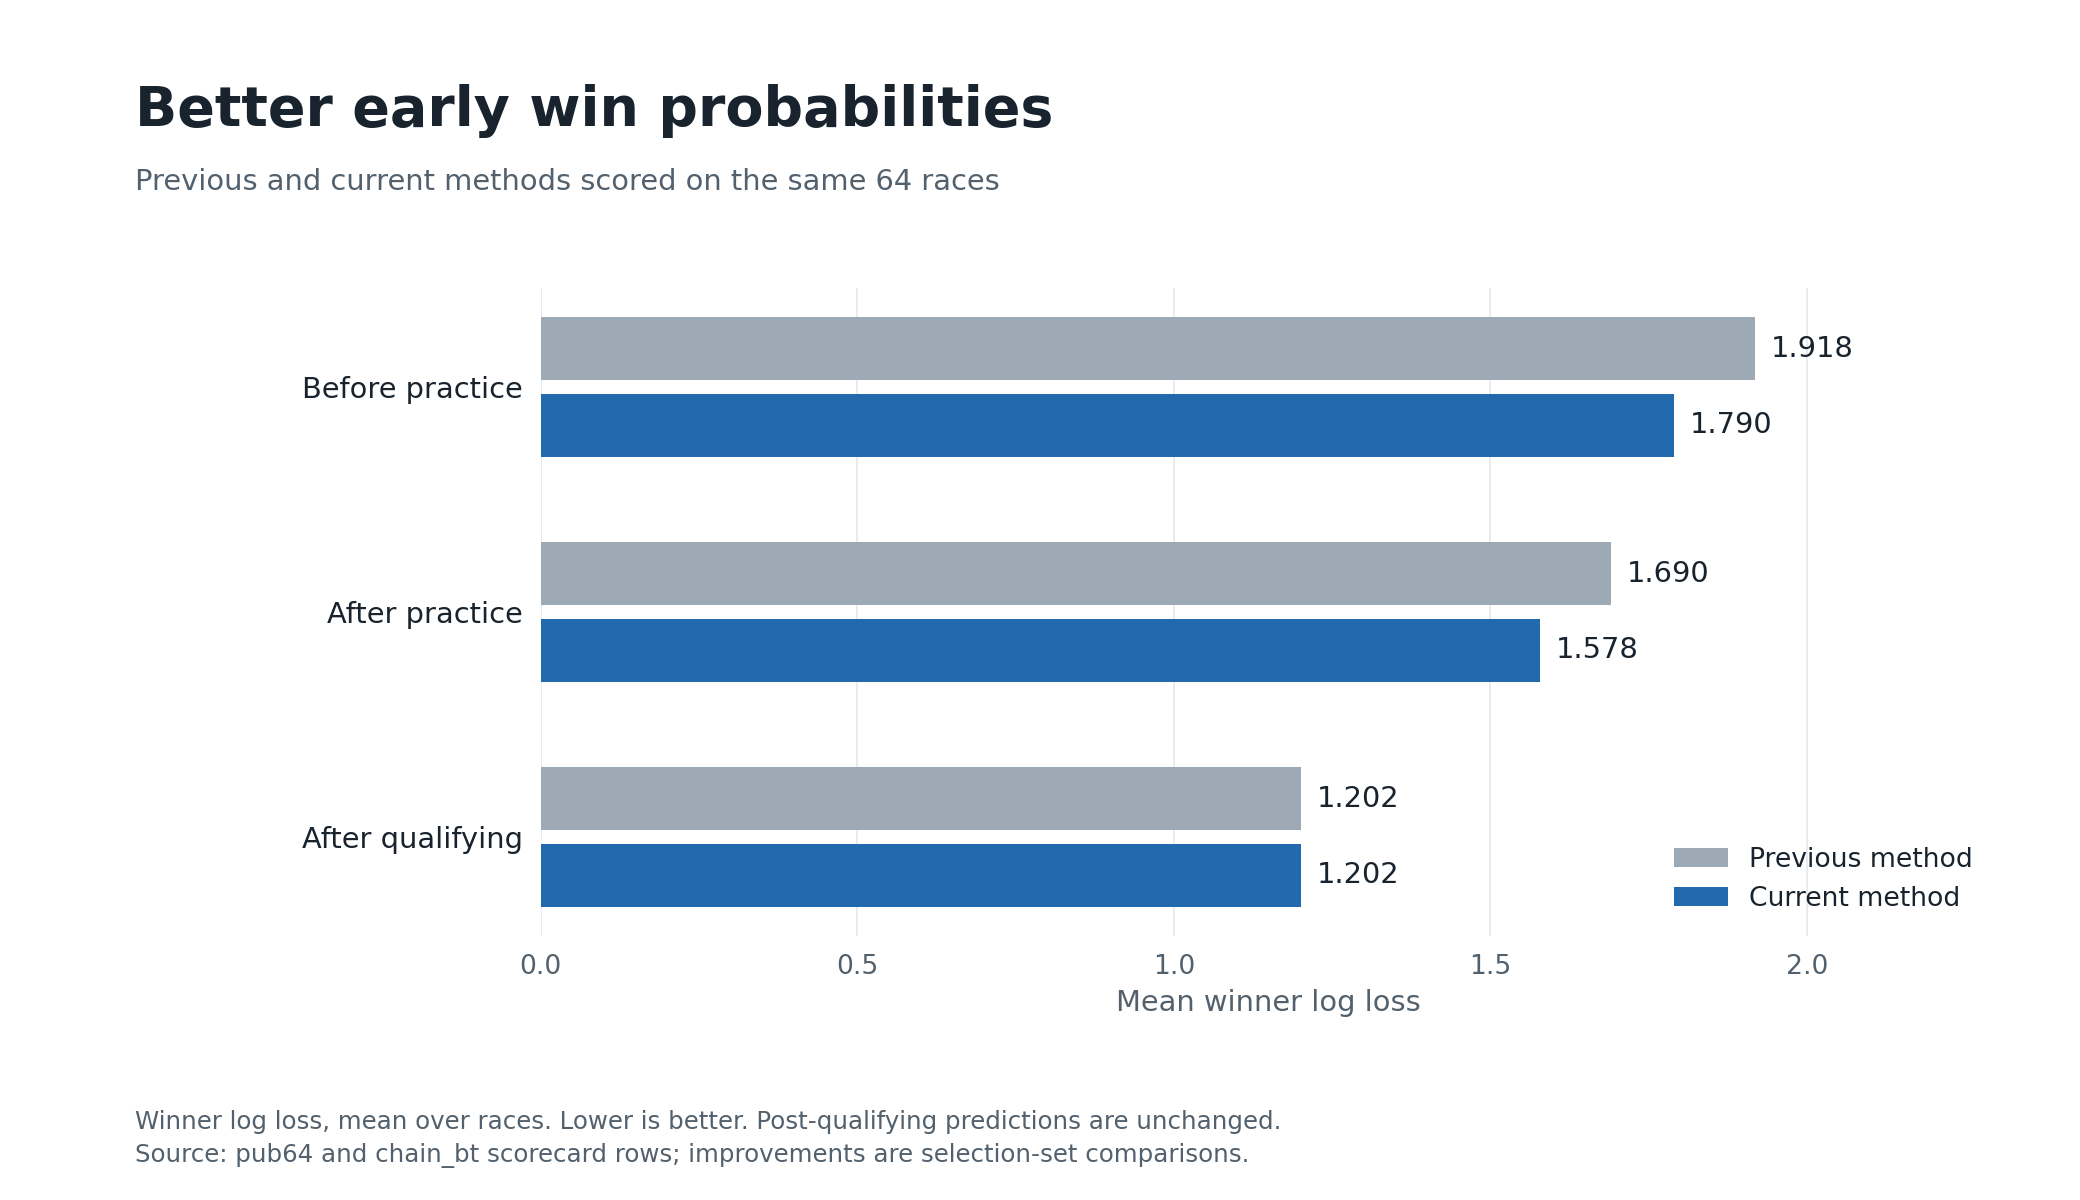
This was a change to how the existing forecasts connected, not a newly added data feed. It improved the earlier forecasts by using a relationship the model had already learned: the starting position is part of the race problem.
The selection set and the grid baseline
I compare model versions on 64 walk-forward races: all rounds of 2024 and 2025, plus the first 16 rounds of 2026. Each forecast uses earlier races for training, with retraining every three rounds. The 64 races are a development selection set used to compare changes, not an untouched final holdout. The evaluation protocol reserves 2026 round 17 onward for a separate holdout.
Across those races, the favourite won 19 times before the weekend, 23 after practice and 35 after qualifying: 29.7%, 35.9% and 54.7%. Agreement between the model's expected order and the finishing order also improved at each stage: rank correlation rose from 0.618 to 0.634 to 0.698.
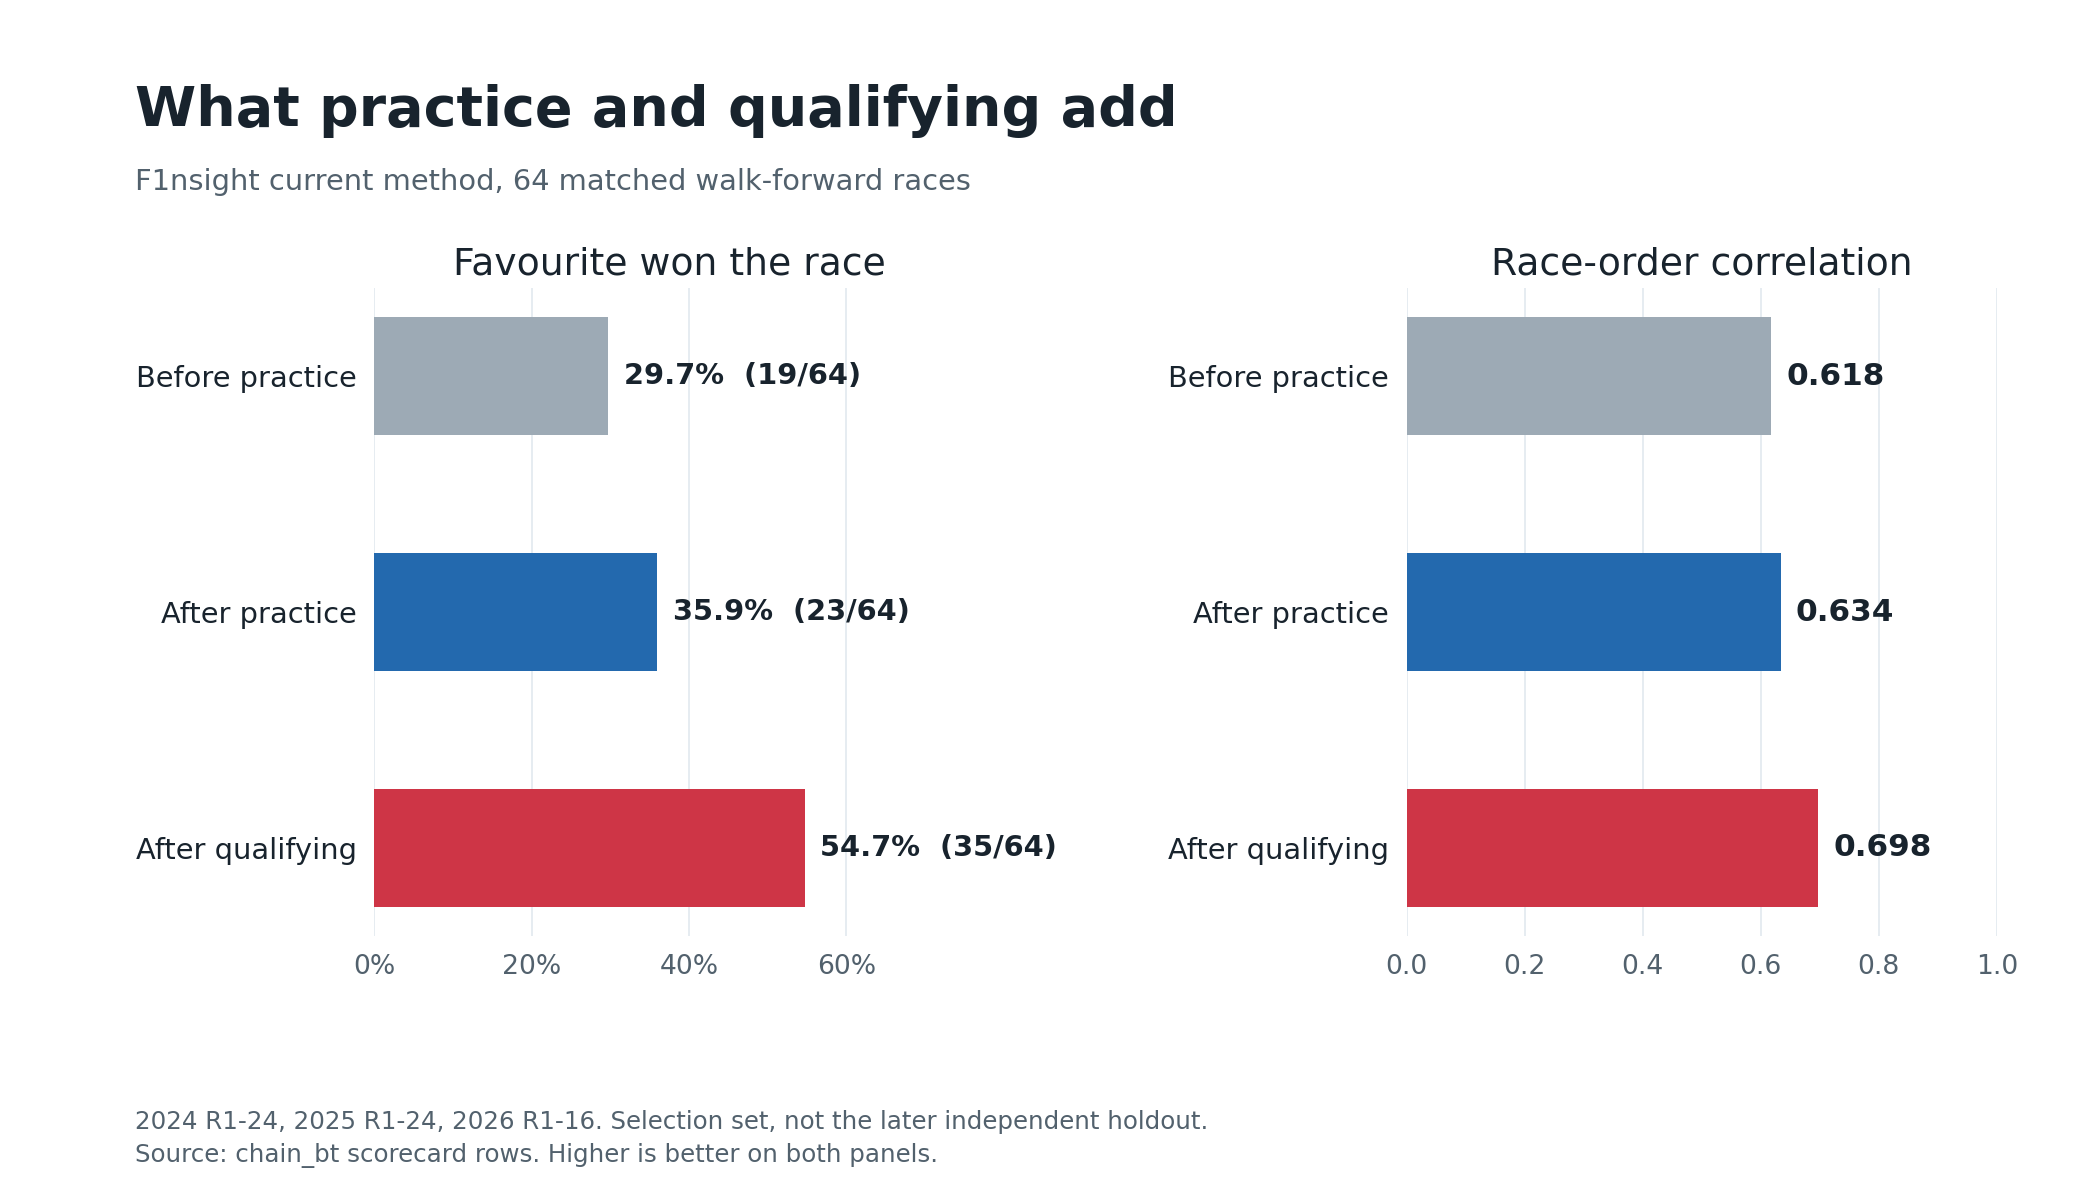
But simply predicting the starting grid as the finishing order got the winner right 38 times, against the model's 35. The model did order the full field a little better: its rank correlation was 0.698, compared with 0.678 for the grid. So the model captured something useful about the field without producing the better winner pick.
Comparing with prediction markets
I looked for public F1 models with dated probabilities for every driver, but did not find an archive I could score. Kalshi and Polymarket have historical prices, making them the outside benchmarks in this comparison. Their prices reflect a crowd's information and opinions, rather than one competing model.
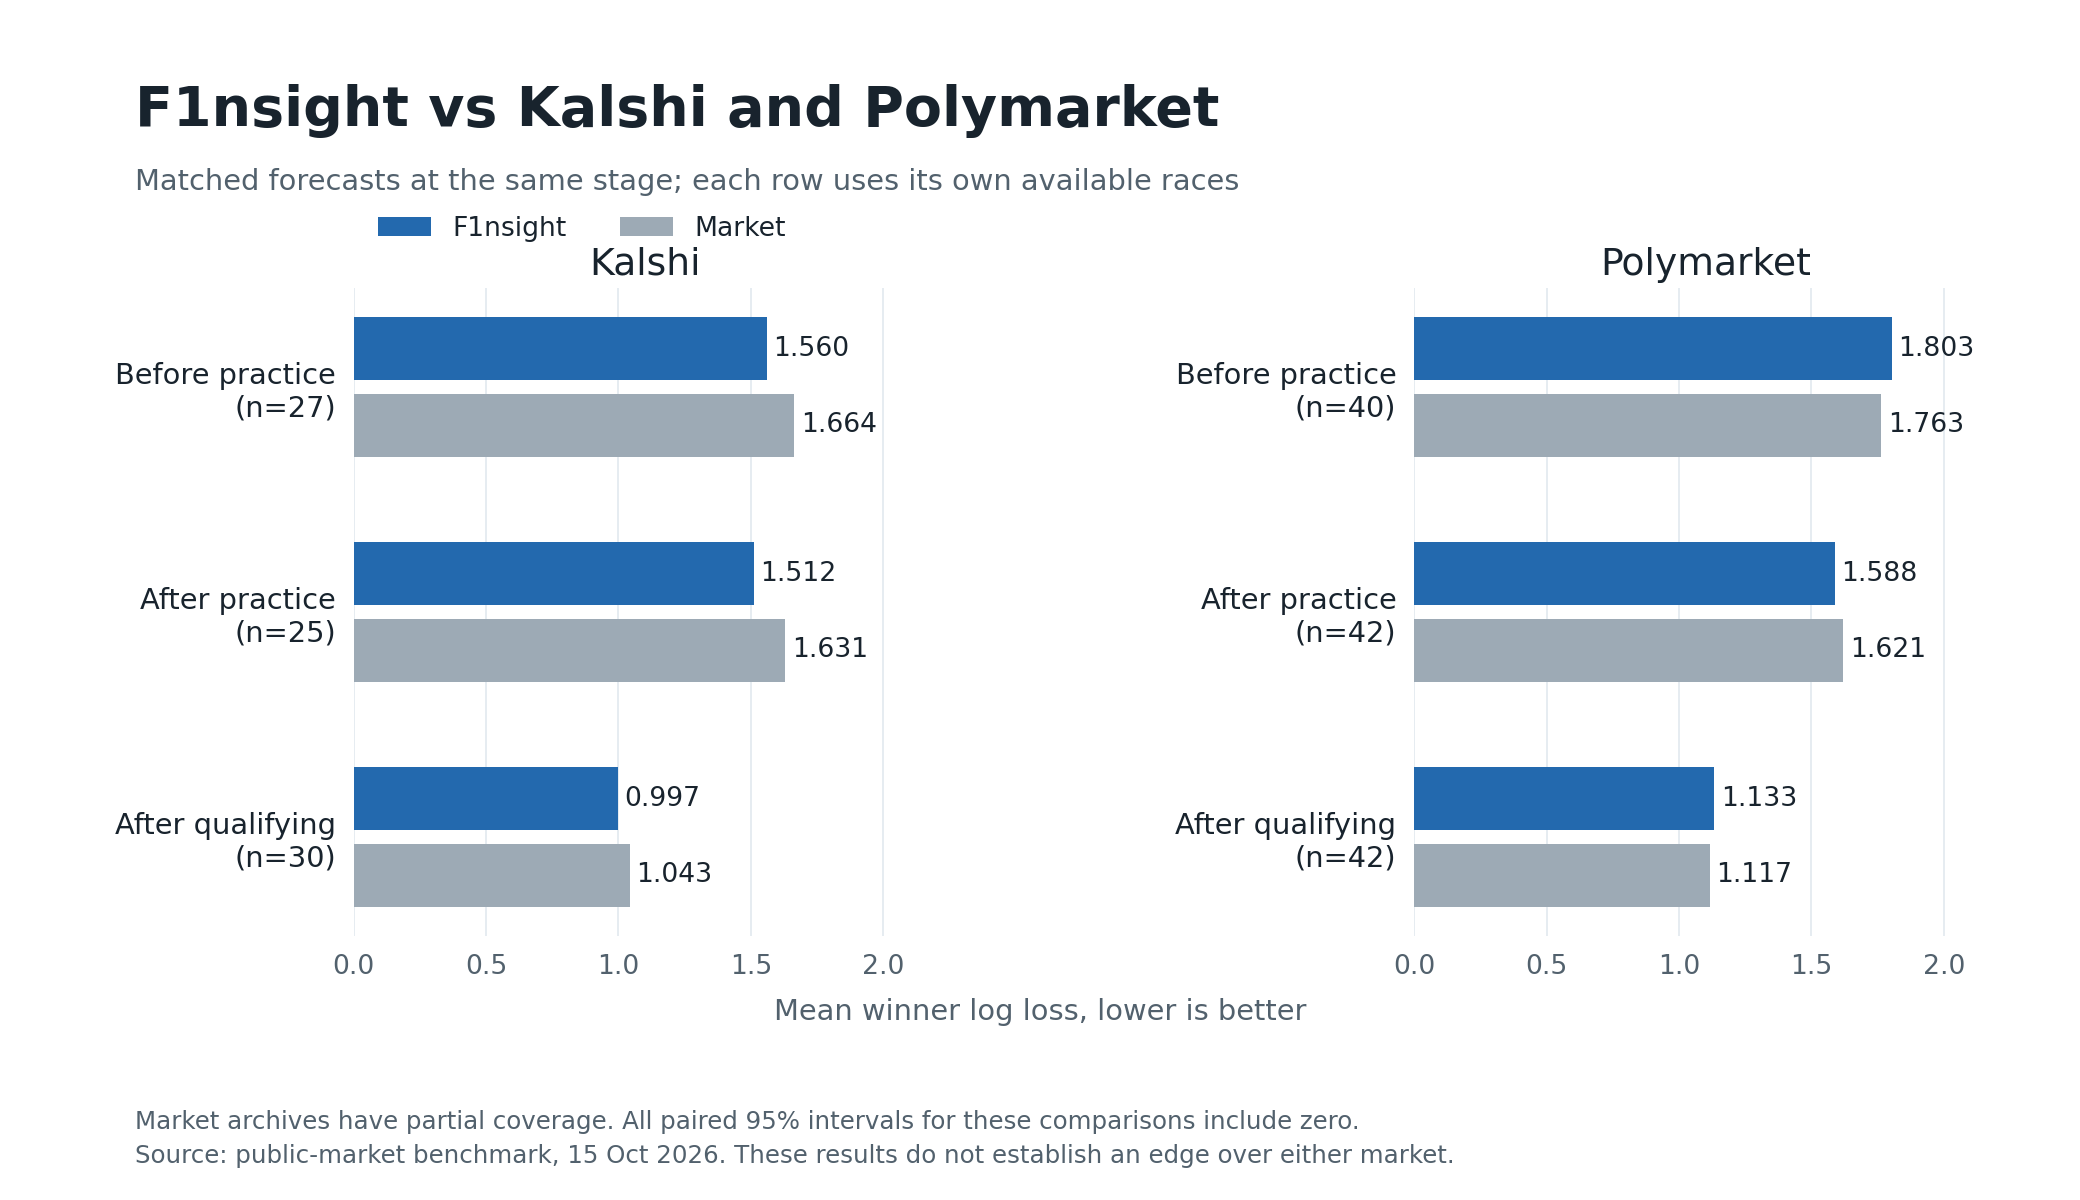
The comparison uses matched races at each stage. For example, after practice, F1nsight's winner log loss was 1.512 against Kalshi's 1.631 on 25 races. On Polymarket's separate set of 42 races, it was 1.588 against 1.621. The paired 95% intervals cross zero for both comparisons. While the model's average scores were lower in these samples, the uncertainty is too wide to conclude it performed better.
| Market | Forecast stage | Matched races | F1nsight log loss | Market log loss |
|---|---|---|---|---|
| Kalshi | Before weekend | 27 | 1.560 | 1.664 |
| Kalshi | After practice | 25 | 1.512 | 1.631 |
| Kalshi | After qualifying | 30 | 0.997 | 1.043 |
| Polymarket | Before weekend | 40 | 1.803 | 1.763 |
| Polymarket | After practice | 42 | 1.588 | 1.621 |
| Polymarket | After qualifying | 42 | 1.133 | 1.117 |
The table covers all three stages, but each row has its own matched sample. Prices come from hourly history and approximate session-end times, so a quote may be nearly an hour old. The full benchmark notes describe the matching windows and paired uncertainty calculations. Kalshi also had better podium log loss at every stage.
How it works
F1nsight runs 20,000 simulated race weekends per forecast. XGBoost rankers and a set transformer estimate driver strengths and retirement risk; a simulator turns those estimates into finishing orders and probabilities. Retirement risk is modeled separately from pace, because a retirement and a slow classified finish are different outcomes. The finishing-order sampler uses a position-dependent temperature, fitted on earlier held-out races: a sharper distribution at the front, with more randomness farther down the field.
| Forecast stage | Additional information available |
|---|---|
| Before the weekend | Driver and team form, circuit history, reliability and standings |
| After practice | Practice lap gaps, long-run pace and eligible sprint results |
| After qualifying | Qualifying performance, the grid, penalties and pit-lane starts |
The same cutoffs apply in training. A pre-weekend row cannot use that weekend's practice or qualifying; no stage can use its target race's result. Qualifying position stays separate from starting position because penalties can change the grid.
The feature data combines race results and records from Jolpica and F1DB, with lap and tyre information from FastF1 and recent session data from OpenF1. Features include recent driver and team form, teammate comparisons, circuit history, reliability, qualifying gaps and practice long-run pace. Training examples start in 2006, with historical features able to look back to 2000. At the first race in the 2024 evaluation, that gave the model 351 earlier races and 7,431 driver-race records.
I evaluate forecasts by walking forward through the calendar, so a race's results don't become training data for its own prediction. Historical source records can be corrected later, though, and I don't have immutable snapshots of every feed as it appeared on race morning. That makes this a historical backtest, not a perfect replay of what the model knew in real time.
The next test
The live forecast can blend its core probabilities with Polymarket prices when those prices are available. The logarithmic pool gives the model a weight of 0.20 before the weekend and 0.35 after practice or qualifying, with market probabilities supplying the remaining weight. That blend is a separate forecast from the core model evaluated here. The next step is to save both, alongside market-only probabilities, at identical times and score them on the reserved races.
I also collect weather observations and timestamped forecasts for research, but weather is not an active production feature. It will need its own evaluation using only forecasts that existed before each race. The F1nsight repository contains the model and evaluation protocol.